
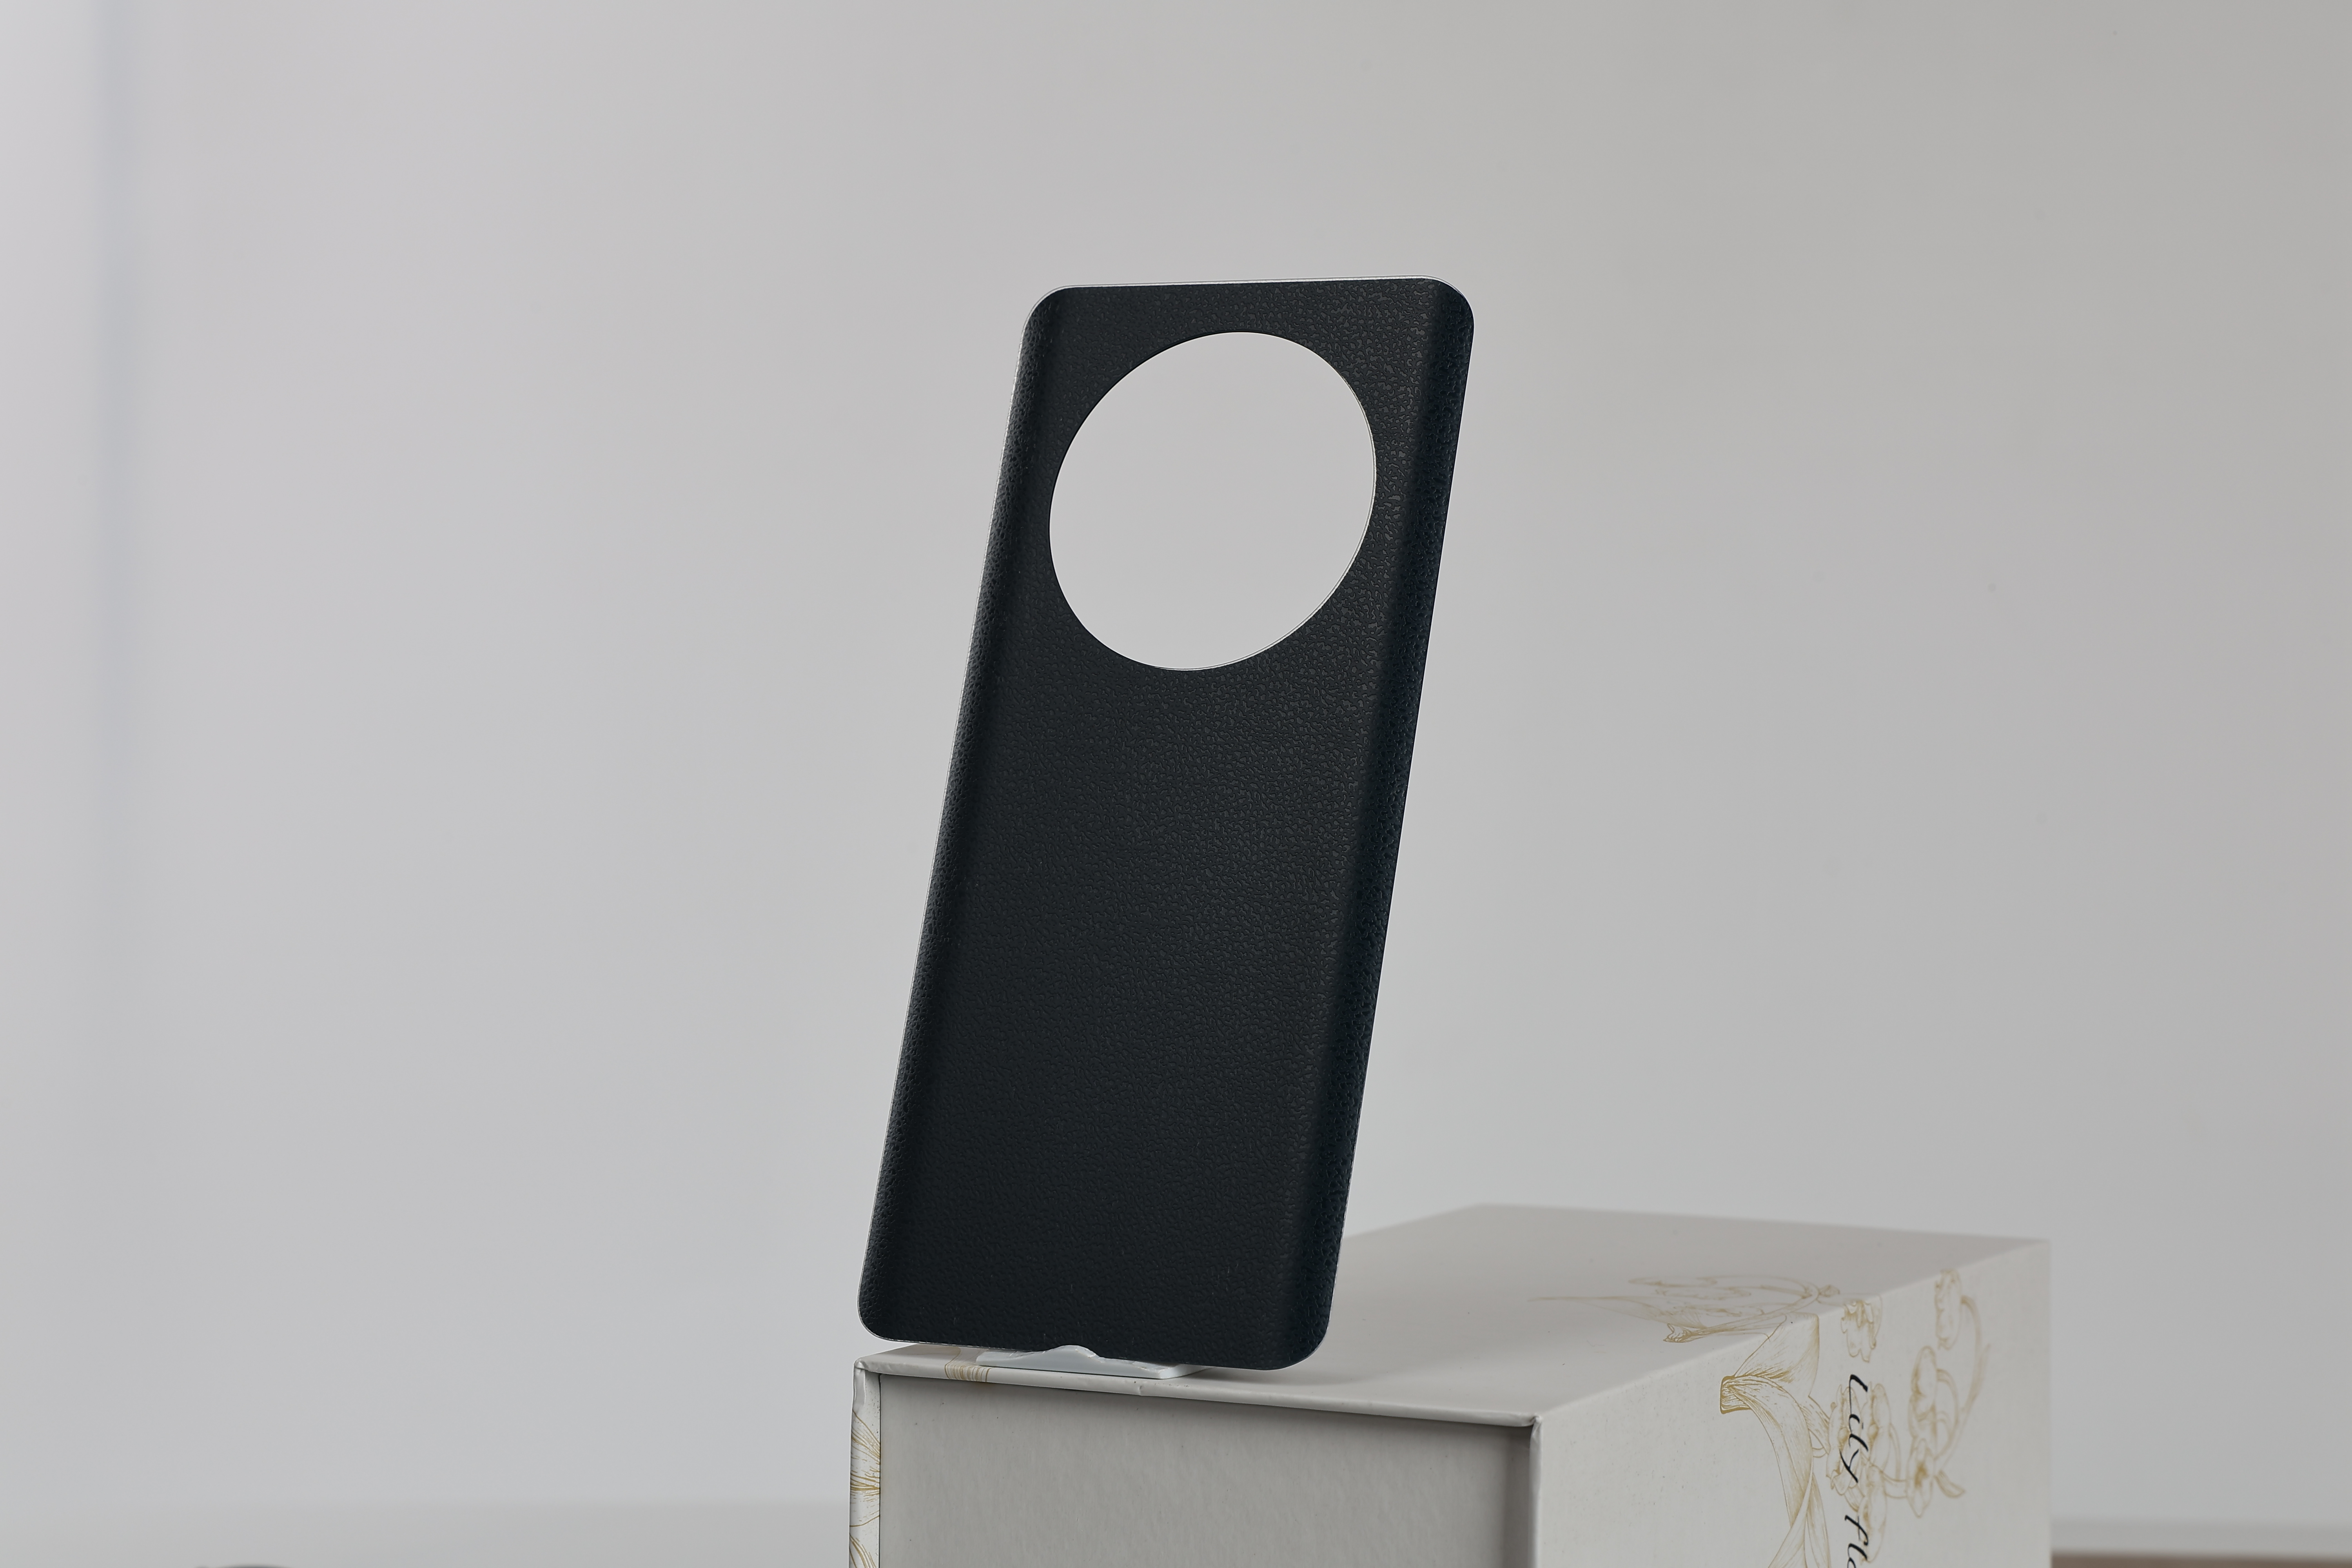
A data-driven analysis of the global smartphone back cover manufacturing industry — material science, production technologies, supply chain dynamics, and strategic insights for B2B professionals
The global smartphone back cover industry is undergoing one of the most significant transformations in its three-decade history. Once a commodity component defined by simple plastic stamping, the back cover has evolved into a precision-engineered subsystem that must simultaneously deliver structural integrity, 5G signal transparency, wireless charging compatibility, aesthetic differentiation, and environmental compliance. This article offers a comprehensive, data-grounded analysis of today's phone back cover manufacturing landscape — from material science fundamentals and production technology to supply chain architecture and strategic market outlook — designed to equip B2B buyers, product managers, and industry analysts with actionable intelligence.
The Global Phone Back Cover Market: Size, Segments & Growth Drivers
The smartphone back cover market — encompassing glass, polymer, ceramic, and composite panels — was valued at approximately USD 8.2 billion in 2024, with projections indicating a compound annual growth rate (CAGR) of 6.8% through 2029, reaching an estimated USD 11.4 billion. This growth trajectory is underpinned by several structural forces:
Premiumization of the smartphone segment. The global average selling price (ASP) of smartphones has risen from approximately USD 280 in 2019 to USD 365 in 2025, driven by consumers upgrading to mid-range and flagship devices. Premium materials — particularly tempered glass back covers and ceramic composites — have moved from a flagship-exclusive feature to a mid-range standard, with devices priced above USD 400 increasingly adopting glass or premium polymer back panels.
5G network expansion and the material shift away from metal. The global 5G subscriber base surpassed 2 billion in 2025, with mmWave deployment accelerating in North America, East Asia, and select European markets. Metal back covers — which dominated the industry from 2012 to 2018 — block high-frequency signals, making glass and advanced polymers the de facto material choice for any 5G-capable device. This structural shift created a permanent demand floor for non-metallic back covers estimated at over 1.4 billion units annually.
Wireless charging adoption. Qi wireless charging penetration in new smartphones exceeded 80% in 2025, with Qi2 (based on Apple's MagSafe magnetic power profile) accelerating adoption in the Android ecosystem. Since wireless charging cannot function through metal, this trend further entrenches glass and polymer as the dominant back cover materials, with magnetic alignment features becoming a standard requirement for mid-to-premium devices.
Aftermarket and refurbishment demand. The global refurbished smartphone market grew to USD 65 billion in 2025, with screen and back cover replacement accounting for approximately 38% of all refurbishment costs. This has created a substantial B2B opportunity for back cover glass replacement components, with aftermarket demand projected to grow at 9.2% CAGR through 2029.
| Region | Market Share (2025) | Growth Rate (CAGR) | Key Characteristics |
|---|---|---|---|
| Asia-Pacific | 56% | 7.5% | Manufacturing hub + largest consumer market; China, India, Vietnam drive volume |
| North America | 18% | 5.8% | Flagship-driven premium segment; strongest MagSafe/Qi2 accessory ecosystem |
| Europe | 14% | 5.2% | Regulatory leadership (EPR, ESPR); rapid shift to sustainable materials |
| Rest of World | 12% | 9.1% | Price-sensitive; fastest growth in Africa, Middle East, Latin America |
Material Science: The Foundation of Back Cover Performance
Back cover material selection is the single most consequential decision in device industrial design. It determines not only aesthetics and tactile feel but also signal performance, drop resistance, thermal behavior, manufacturing cost, and environmental footprint. The industry currently operates across five material families, each with distinct performance profiles and application sweet spots:
1. Chemically Strengthened Alkali-Aluminosilicate Glass
This category — represented by Corning Gorilla Glass (now in its seventh generation, Victus 3), Schott Xensation, and AGC Dragontrail — accounts for approximately 65% of all premium smartphone back covers. The material is produced via the fusion-draw or float process to create a pristine glass sheet, then subjected to ion-exchange strengthening: the glass is immersed in a molten potassium nitrate (KNO₃) bath at approximately 420°C, where smaller sodium ions (Na⁺) in the glass matrix are replaced by larger potassium ions (K⁺), creating a compressive stress layer typically 40-100 μm deep with compressive stress values of 650-900 MPa. This engineered stress profile gives the glass its characteristic damage resistance — surface flaws are held closed by compressive force, preventing crack propagation.
For back cover applications, the key specification is not surface hardness (which is consistent at ~6-7 Mohs for all aluminosilicate glasses) but rather drop performance on rough surfaces — the primary failure mode for back covers. Modern glass back covers are typically specified at 0.55-0.70 mm thickness, balancing weight reduction against structural robustness. The latest formulations incorporate micro-crystalline phases within the glass matrix to improve both transparency and impact resistance simultaneously.
2. Microcrystalline Glass (Nano-Ceramic)
Microcrystalline glass, commonly referred to as nano-ceramic or glass-ceramic composite, represents the current frontier in back cover material science. Unlike traditional glass — which is amorphous — microcrystalline glass contains a controlled dispersion of crystalline phases (typically 50-95 nm crystal size) embedded in a glass matrix. This dual-phase structure provides a unique combination of properties: transparency approaching that of pure glass, hardness of 7-8 Mohs, and fracture toughness 2-3× higher than standard aluminosilicate glass.
The material is produced via a two-stage process: base glass formulation (typically a lithium-aluminosilicate system) is melted and formed, then subjected to a carefully controlled crystallization heat treatment at 650-850°C over 2-6 hours, during which nano-scale crystal phases nucleate and grow. The resulting material costs approximately 3-5× more than standard strengthened glass, limiting its current application to flagship devices priced above USD 800. However, as manufacturing yields improve and production scales, industry analysts project microcrystalline glass penetration in the USD 500-800 device segment to reach 25% by 2028.
3. Polycarbonate (PC) and PMMA
Polymer back covers — primarily polycarbonate (PC), polymethyl methacrylate (PMMA, acrylic), and PC/PMMA composites — dominate the sub-USD 300 device segment and hold approximately 30% of the total market by volume. Modern polymer back covers are a significant departure from the "cheap plastic" perception of the early smartphone era. Advanced formulations incorporate glass fiber reinforcement (10-30% by weight) for improved stiffness, UV stabilizers to prevent yellowing, and hard-coat layers that achieve pencil hardness ratings of 3H-5H — approaching the scratch resistance of glass at lower cost.
The primary advantages of polymer back covers are impact resistance (PC does not shatter), lower density (1.2 g/cm³ vs. 2.5 g/cm³ for glass — a 52% weight reduction), and significantly lower material cost. The trade-off is reduced surface hardness and a perception of lower quality among premium-conscious consumers. However, the gap is narrowing: multilayer PC/PMMA composite sheets with nano-imprint lithography (NIL) texture replication can now produce visual effects indistinguishable from glass at arm's length, making them increasingly popular for devices in the USD 200-400 range.
4. Thermoplastic Polyurethane (TPU) and Elastomeric Materials
While primarily associated with protective cases, TPU and related elastomers are increasingly used as back cover substrates in ruggedized and outdoor-oriented devices. These materials offer exceptional impact absorption, with Shore hardness values typically ranging from 70A to 95A, and can be formulated for specific tactile qualities — from soft-touch matte to grippy textured finishes. TPU back covers are often combined with a rigid PC frame for structural support, creating a hybrid structure that passes MIL-STD-810H drop testing with minimal thickness penalty.
5. Engineering Ceramics (Zirconia and Alumina)
Yttria-stabilized zirconia (YSZ) ceramic back covers represent the premium extreme of the market, with hardness exceeding 8 Mohs (essentially scratch-proof under normal use), a luxurious heft (density ~6.0 g/cm³), and a distinctive cool-to-the-touch thermal conductivity. The material is produced via ceramic injection molding (CIM) followed by high-temperature sintering at 1,400-1,600°C and diamond polishing to achieve a mirror finish. Manufacturing cost is approximately 8-12× that of glass, limiting ceramic to ultra-premium devices and fashion-brand collaborations. Annual global production capacity for phone-grade ceramic back covers is estimated at only 15-20 million units — less than 1.5% of the total market — making it a niche but strategically important material for brand differentiation.
| Property | Al-Si Glass | Microcrystalline | PC/PMMA | TPU | ZrO₂ Ceramic |
|---|---|---|---|---|---|
| Density (g/cm³) | 2.4-2.5 | 2.5-2.6 | 1.18-1.20 | 1.10-1.25 | 5.9-6.1 |
| Hardness (Mohs) | 6-7 | 7-8 | 2-3 (HB-3H) | <2 (Shore 70A-95A) | 8-8.5 |
| Fracture Toughness (MPa·m½) | 0.7-0.8 | 1.5-2.5 | 2.0-4.0 | N/A (elastic) | 4.0-6.0 |
| 5G Signal Loss (dB) | <0.5 | <0.5 | <0.3 | <0.2 | <0.8 |
| Relative Cost Index | 1.0 (base) | 3.0-5.0× | 0.4-0.7× | 0.3-0.5× | 8.0-12.0× |
| Typical Device Bracket | USD 300+ | USD 800+ | USD 100-400 | Rugged/outdoor | USD 1,000+ |
Manufacturing Processes: The Production Technology Stack
The transformation of raw material into a finished phone back cover involves a multi-stage manufacturing sequence, with each step contributing to final product quality, yield rate, and unit cost. Understanding this process chain is essential for B2B buyers evaluating supplier capability and product consistency.
Stage 1: Substrate Cutting and Edge Profiling
For glass back covers, the process begins with large-format mother glass sheets (typically Generation 5: 1,100 × 1,300 mm or Generation 6: 1,500 × 1,850 mm) that are cut to individual panel dimensions using CNC diamond wheel scribing or picosecond laser cutting. Laser cutting has gained dominance for complex shapes — particularly multi-hole porous glass back covers for camera arrays and sensors — because it produces cleaner edges with minimal micro-crack generation, eliminating the need for post-cut grinding on internal features. Edge profiling via 5-axis CNC machining follows, creating the precise chamfer geometry (typically 0.05-0.15 mm radius) that mates with the device frame, with dimensional tolerances held to ±0.03 mm.
Stage 2: 3D Hot Bending and Thermoforming
The transition from flat (2D/2.5D) to curved (3D) back covers — where edges curve up to meet the frame, creating the seamless "unibody" feel — requires precision hot bending. Glass panels are heated to their softening point (typically 650-750°C for aluminosilicate glass, higher for microcrystalline formulations), placed in graphite or tungsten carbide molds under controlled pressure (0.5-2.0 MPa), and held for 30-120 seconds before controlled cooling at 2-5°C/minute to anneal internal stresses. Mold design is a closely guarded competitive advantage: the precision of the mold surface finish directly determines the final back cover's optical quality, and mold life (typically 50,000-200,000 cycles before resurfacing) is a major factor in per-unit manufacturing cost.
For polymer back covers, thermoforming (heating PC/PMMA sheet to 160-190°C and vacuum-forming into a mold) or injection-compression molding achieves similar 3D geometries at higher throughput and lower cost, though with less dimensional precision than glass hot bending. Injection-compression molding, in particular, has emerged as the preferred method for high-volume one-piece glass back cover alternatives in polymer, achieving optical-grade surface finishes directly from the tool.
Stage 3: Chemical Strengthening (Ion Exchange)
For glass back covers, chemical strengthening is the critical performance-defining step. The shaped and edge-finished glass panel is preheated to 350-380°C to prevent thermal shock, then immersed in a molten KNO₃ bath (99.9% purity, maintained at 400-430°C) for 2-8 hours depending on target compressive stress (CS) and depth of layer (DOL) specifications. The process parameters are tightly controlled: bath temperature uniformity must be maintained within ±2°C across the entire tank to ensure consistent ion exchange, and potassium salt must be continuously analyzed for sodium ion contamination — Na⁺ concentrations exceeding 5,000 ppm in the bath reduce exchange efficiency and must trigger a salt change.
Post-strengthening, each panel undergoes surface stress measurement using a surface stress meter (FSM-6000LE or equivalent) based on optical waveguide principles. Acceptance criteria vary by application: flagship devices typically specify CS ≥ 700 MPa at DOL ≥ 40 μm, while mid-range devices may accept CS ≥ 550 MPa at DOL ≥ 30 μm. Drop performance on 180-grit sandpaper — the industry-standard rough-surface drop test — correlates strongly with these parameters, with CS × DOL product values above 22,000 MPa·μm generally required for reliable 1.5-meter drop survival rates above 80%.
Stage 4: Surface Treatment and Decoration
The surface treatment chain transforms a transparent or translucent substrate into the finished visual and tactile product. This multi-step process is where brand identity, product differentiation, and perceived quality are created:
Screen printing and pad printing apply opaque color layers (typically 6-12 layers of ceramic ink, each 8-15 μm thick) to the interior surface of the glass, creating the base color and any gradient or pattern effects. Each layer is cured at 150-180°C for 15-30 minutes. Registration accuracy between layers must be held to ±0.05 mm to prevent color bleeding at edges.
Physical Vapor Deposition (PVD) applies metallic, mirror, or color-shifting finishes in a vacuum chamber. The back cover panels are loaded onto fixtures in a high-vacuum environment (10⁻⁴-10⁻⁶ Pa), and target materials (indium, tin, titanium, silicon dioxide) are vaporized via electron beam or magnetron sputtering, depositing thin films 50-500 nm thick onto the substrate. Multi-layer PVD stacks (5-15 alternating layers of metal oxides with different refractive indices) produce the iridescent, color-shifting effects popular in premium devices. A single PVD chamber can process 200-500 panels per batch with a cycle time of 60-90 minutes.
Anti-glare (AG) etching creates a matte surface texture that diffuses reflected light and resists fingerprints. The process involves either chemical etching (immersion in hydrofluoric acid-based solution at controlled concentration and temperature to create a micro-rough surface with Ra 0.2-0.8 μm) or physical blasting (alumina or silica particles propelled at the surface). Chemical etching produces more uniform results and is preferred for premium frosted glass back cover applications, while physical methods are lower cost but produce wider gloss variation.
Anti-fingerprint (AF) coating applies a fluoropolymer monolayer (typically perfluoropolyether, PFPE, 10-20 nm thick) to the exterior glass surface via vacuum deposition or spray coating. This creates a hydrophobic, oleophobic surface with water contact angle > 110° that resists fingerprint smudging and makes the surface easier to clean. AF coating durability — measured by the number of abrasion cycles before the water contact angle drops below 100° — ranges from 3,000 cycles for consumer-grade coatings to over 20,000 cycles for industrial-grade formulations used in flagship devices.
Stage 5: Quality Assurance and Testing
Finished back covers undergo a battery of quality control tests before shipment. Critical inspection points include: dimensional measurement via automated optical inspection (AOI) with ±0.02 mm accuracy; surface defect detection using dark-field illumination and machine vision to identify scratches, pits, and inclusions larger than 20 μm; colorimetry using spectrophotometers to verify Delta E < 1.5 from the master standard; drop testing on instrumented drop towers (ball drop at specified height and steel ball diameter, or full-device drop in controlled orientations); and environmental cycling (-40°C to +85°C, 72-hour duration) to verify coating adhesion and thermal shock resistance. The industry standard for outgoing quality level (OQL) on premium back covers is < 0.5% defect rate, with some OEM specifications requiring < 0.1% for flagship devices.
Supply Chain Architecture: Manufacturing Clusters and Vertical Integration
The global phone back cover supply chain is highly concentrated geographically, with the Pearl River Delta in Guangdong Province, China accounting for an estimated 65-70% of global production capacity. Three interconnected manufacturing clusters form the backbone of the industry:
Dongguan
The largest cluster for glass processing and surface treatment. Houses numerous mid-to-large scale factories specializing in CNC machining, chemical strengthening, and PVD coating for glass back covers. Estimated share of global glass back cover output: 35-40%.
Huizhou
Home to several of the largest integrated glass cover manufacturers. Benefits from lower land and labor costs relative to Shenzhen, with newer factories incorporating Industry 4.0 automation. Estimated share: 20-25%.
Shenzhen
The innovation and headquarters hub. Concentrates on R&D, mold fabrication, prototype development, and high-value surface treatment (advanced PVD, texturing). Production volume has shifted outward but IP remains concentrated here. Estimated share: 10-15%.
The supply chain operates on a three-tier structure. Tier 1 consists of raw material suppliers — Corning (USA), Schott (Germany), AGC (Japan) for glass substrates; Covestro, SABIC, Mitsubishi Chemical for polymer resins; Merck, BASF for specialty chemicals and inks. Tier 2 encompasses the processing and manufacturing layer — the hundreds of factories in Guangdong that cut, strengthen, coat, and decorate back covers. Tier 3 comprises final assembly integrators — the Foxconns, Pegatrons, and Luxshares of the world — that install the back cover into the completed device, along with aftermarket distributors and B2B importers serving the replacement and custom phone back cover markets.
Vertical integration is a defining competitive characteristic. Leading manufacturers increasingly control the full process chain — from glass cutting through to finished decorated product — under one roof. This eliminates inter-process logistics, reduces handling damage, and enables tighter quality control. The most advanced factories now deploy Manufacturing Execution Systems (MES) that track each individual back cover panel through every process step, logging machine parameters, operator identity, and inspection results in real time. This traceability is increasingly required by OEM customers and is a key differentiator when B2B buyers evaluate manufacturing partners.
Design Innovation and Technology Convergence Trends
Several convergence trends are reshaping back cover design requirements, creating both engineering challenges and market opportunities:
Camera module integration. The proliferation of multi-lens camera arrays has transformed back cover design from a simple flat panel into a precision-machined component with multiple large-diameter holes, each requiring ±0.05 mm positional accuracy relative to the device frame. The trend toward larger camera bumps (now projecting 2-4 mm from the back surface on flagship devices) has driven demand for 3D glass forming and multi-step CNC machining. Some manufacturers now produce the camera lens surround as an integral part of the back cover, requiring five-axis machining to achieve the complex compound curvature.
Texture and tactile innovation. The back cover surface has become a primary brand touchpoint. Textured back covers now employ nano-imprint lithography to replicate natural materials (leather grain, wood, stone) with sub-micron fidelity, UV transfer printing to create depth illusion effects, and gradient etching to produce surfaces that transition from glossy to matte across the panel. These processes add USD 0.50-1.50 per unit to manufacturing cost but provide significant brand differentiation value.
In-Mold Labeling (IML) and In-Mold Decoration (IMD). For polymer back covers, IML/IMD technologies have become the standard for high-quality decoration. A pre-printed polycarbonate film (0.125-0.375 mm thick) is placed in the injection mold cavity, and molten resin is injected behind it, bonding the decorative film to the substrate in a single step. This produces a scratch-resistant decorative surface (the ink is protected behind the film) with photographic-quality image resolution and the ability to create metallic, gradient, and texture effects without post-processing. IML back covers now account for over 60% of the sub-USD 300 polymer back cover market.
Magnetic alignment integration. The proliferation of MagSafe and Qi2 magnetic accessories has made integrated magnet arrays a standard feature. Magnetic phone back covers embed a circular array of NdFeB magnets (typically 16-36 magnets, N48SH or N52 grade, 1.5-2.0 mm diameter × 0.8-1.2 mm thickness) in a stamped metal alignment ring bonded to the interior surface. The engineering challenge lies in maintaining magnet positional accuracy (typically ±0.10 mm) while ensuring the magnetic field does not interfere with the device's compass, NFC antenna, or wireless charging coil — a constraint that drives precise shielding material selection (Mu-metal or nanocrystalline ribbon) and careful placement in the layer stack.
The 5G Imperative: How Network Technology Shapes Back Cover Engineering
The rollout of 5G networks — particularly millimeter-wave (mmWave) deployments operating at 24-47 GHz — has fundamentally altered the material selection calculus for smartphone back covers. This is arguably the single most important technology driver in the industry today:
Signal transparency requirements. At mmWave frequencies, even thin metal layers cause catastrophic signal attenuation (40-60 dB loss through 0.3 mm aluminum). This has permanently eliminated metal as a viable back cover material for any device supporting mmWave 5G, cementing glass and polymer as the only practical options. The signal loss through 0.6 mm aluminosilicate glass at 28 GHz is typically 0.8-1.5 dB — low enough to be compensated by antenna design, but only if the glass is free of conductive coatings or metallic decorative layers. This creates a direct conflict with aesthetic requirements for metallic finishes, which must now be achieved through non-conductive alternatives such as multi-layer dielectric PVD stacks or nano-imprint texturing with optical interference effects.
Thermal management implications. 5G modems, particularly in mmWave mode, generate significantly more heat than 4G LTE chipsets — peak thermal output can reach 5-8 watts in sustained data transfer scenarios. The back cover plays a critical role in passive thermal dissipation, and material thermal conductivity becomes a design parameter. Glass (thermal conductivity ~1.0 W/m·K) is a thermal insulator; ceramic (~3.0 W/m·K for zirconia) offers better heat spreading; polymer (~0.2 W/m·K) is the poorest thermal conductor. This has driven interest in thermally enhanced back covers incorporating graphite sheets, vapor chambers, or thermally conductive fillers — adding complexity and cost but becoming necessary for sustained 5G performance in premium devices.
Wireless charging coil integration. Wireless charging back covers must accommodate an embedded copper coil assembly (typically 0.3-0.6 mm total thickness including ferrite shield) bonded to the interior surface. The back cover thickness above the coil directly affects charging efficiency — every 0.1 mm of additional glass thickness reduces Qi charging efficiency by approximately 1.5-2.5% due to increased coil-to-charger separation. This creates a tension between the market demand for thicker glass (perceived quality, drop resistance) and the engineering demand for thinner glass (charging efficiency, thermal performance), with 0.55-0.65 mm emerging as the compromise range for Qi2-compatible premium devices.
Competitive Landscape: Who Shapes the Back Cover Industry?
The competitive structure of the phone back cover industry can be understood in three layers, each with distinct dynamics:
Glass substrate suppliers form an oligopolistic upstream. Corning (Gorilla Glass) commands an estimated 55-60% market share in premium smartphone cover glass, with Schott (Xensation, primarily serving Samsung and Chinese OEMs) at 20-25% and AGC (Dragontrail) at 10-15%. These companies compete on glass composition (ion-exchange efficiency, optical clarity, damage resistance), thickness capability (the drive toward thinner glass with equal strength), and pricing — with substrate cost typically USD 3-8 per phone depending on glass grade, thickness, and volume. Supply agreements are generally multi-year with complex pricing formulas tied to volume commitments and technology roadmaps.
Back cover processors and integrators form a fragmented midstream. Several hundred companies in China's manufacturing clusters compete on processing capability (CNC precision, chemical strengthening expertise, coating quality), capacity (monthly output ranging from 100,000 to 10+ million units), and customer relationships. The top 10 processors account for approximately 45% of global output, with the remainder split among hundreds of smaller specialists. Key competitive differentiators include: yield rate (top-tier factories achieve 92-96% overall yield from raw glass to finished product; industry average is 80-85%), automation level (directly impacts quality consistency and cost), cleanroom class (Class 10,000-100,000 required for coating operations), and certification portfolio (ISO 9001, ISO 14001, IATF 16949 for automotive-adjacent quality management).
Aftermarket distributors and brand owners form the downstream. This segment — encompassing replacement parts distributors, private-label brands, and e-commerce sellers — represents approximately 20-25% of total industry volume and typically operates on shorter lead times, smaller order quantities, and more flexible specifications than the OEM channel. The aftermarket segment is the primary entry point for new manufacturing entrants and drives innovation in rapid-turnaround customization and small-batch production.
Strategic Outlook: What B2B Buyers Need to Know for 2026-2028
Based on the trends analyzed above, several strategic implications emerge for B2B buyers and industry participants:
Material diversification is becoming a procurement necessity, not a luxury. The regulatory push toward sustainability (particularly EU ESPR and EPR mandates), combined with 5G signal requirements and wireless charging ubiquity, means no single material can meet all market requirements. B2B buyers should develop supplier relationships across at least two material categories (glass + polymer minimum) to serve different device tiers and regional compliance requirements. The supplier that can deliver both glass and polymer back covers with consistent quality control is inherently more valuable than a specialist in either alone.
Processing capability is more important than raw material access. While relationships with Corning, Schott, or AGC are important, the real value creation — and the primary source of quality differentiation — occurs in the processing chain: cutting precision, bending accuracy, strengthening uniformity, and coating consistency. When evaluating suppliers, prioritize those with in-house chemical strengthening, multiple PVD chambers, and automated optical inspection over those who subcontract processing steps. A supplier with a fully integrated production facility will consistently outperform a network of subcontractors on quality, lead time, and cost predictability.
Automation is the quality consistency lever. The gap between industry-leading and average back cover quality is primarily a function of automation level. Automated loading/unloading robots eliminate handling damage (which accounts for 3-5% of yield loss in manual operations). Automated optical inspection catches defects that human inspectors miss due to fatigue. And MES-based process control eliminates the parameter drift that causes batch-to-batch variation. When auditing suppliers, evaluate the number of manual handling steps in the process flow — each one represents a defect opportunity. Premium suppliers targeting flagship OEM business have reduced manual handling to fewer than three touch points per panel from raw material to finished product.
The industry is consolidating, and scale matters. The capital intensity of modern back cover manufacturing — a single automated CNC line costs USD 800,000-1,500,000, a PVD chamber USD 300,000-800,000, and chemical strengthening lines USD 200,000-500,000 — creates natural barriers to entry and drives consolidation. Small-volume buyers (below 50,000 units/month) should prioritize suppliers who value long-term partnership over spot transaction pricing, as their business is not volume-attractive to the largest players. Medium-volume buyers (50,000-500,000 units/month) have the broadest supplier options and should use competitive bidding while maintaining at least two qualified sources for supply chain resilience. Large-volume buyers (500,000+ units/month) work in a seller's market for premium-quality output and should consider strategic partnerships or capacity reservation agreements to secure allocation.
Frequently Asked Questions
Q: What is the most commonly used material for phone back covers in 2026?
Chemically strengthened alkali-aluminosilicate glass (such as Corning Gorilla Glass or Schott Xensation) is the dominant material, accounting for approximately 55-60% of the global back cover market by value and 45% by unit volume. It is used in virtually all smartphones priced above USD 300 and increasingly in devices in the USD 200-300 range. Polycarbonate and PC/PMMA composites account for most of the remaining volume, particularly in budget and mid-range devices.
Q: How does 5G affect back cover material choices?
5G — especially mmWave frequencies (24-47 GHz) — requires the back cover to be essentially transparent to radio signals. Metal back covers block 5G signals, which is why the entire industry has shifted away from metal since 2019. Glass and polymer both provide excellent signal transparency, with typical signal loss below 1.5 dB at mmWave frequencies. However, conductive decorative coatings (metallic PVD layers, metallic inks) can significantly degrade signal performance and must be carefully designed — either limited to non-antenna areas or replaced with dielectric alternatives.
Q: What are the key quality metrics B2B buyers should evaluate when sourcing back covers?
Critical quality metrics include: dimensional tolerance (±0.05 mm for fit to frame), surface defect specification (no visible defects > 0.1 mm under 1,000 lux inspection lighting), compressive stress and depth of layer (CS ≥ 550 MPa, DOL ≥ 30 μm minimum for glass), drop performance (survival rate at specified height on 180-grit sandpaper), AF coating durability (water contact angle > 100° after 3,000+ abrasion cycles), color consistency (Delta E < 2.0 from master standard), and overall cosmetic yield rate from supplier inspection. Buyers should request detailed quality control documentation — including measurement methodology and sampling plans — rather than accepting summary statistics.
Q: What is driving the shift from 2D/2.5D to 3D curved back covers?
Three factors are driving 3D adoption: aesthetic differentiation (curved edges create a seamless transition between the back cover and the device frame, perceived as more premium), ergonomic improvement (curved edges improve in-hand comfort versus sharp transitions), and structural integration (3D covers can wrap around the device frame slightly, improving drop survivability by distributing impact forces). 3D hot bending adds approximately USD 0.80-1.50 to per-unit manufacturing cost and 2-5% to yield loss, but commands a price premium of USD 2-4 per unit in the B2B market — making it attractive for both manufacturers and device brands in the mid-to-premium segments.
Q: How are sustainability regulations affecting the back cover industry?
EU regulations — particularly the Ecodesign for Sustainable Products Regulation (ESPR) and Extended Producer Responsibility (EPR) for electronics — are the primary drivers of sustainability requirements. These regulations mandate: material traceability (knowing the origin and composition of all materials in the product), repairability (the back cover must be removable and replaceable with commonly available tools), recycled content (targets for post-consumer recycled material in new products), and end-of-life management (producer financial responsibility for collection and recycling). B2B buyers exporting to the EU must ensure their suppliers can provide material composition declarations, recycled content certification, and repairability documentation. Suppliers who have invested in ISO 14001 environmental management and obtained recycled material certifications (such as GRS — Global Recycled Standard) have a significant competitive advantage in the European market.
Stay Informed on the Phone Back Cover Industry
At Tenwinglass, we combine over a decade of glass processing expertise with continuous investment in automation and process control. Whether you need standard glass back covers, custom-engineered polymer solutions, or consultation on material selection for your next device, our team is ready to support your procurement and product development goals.