
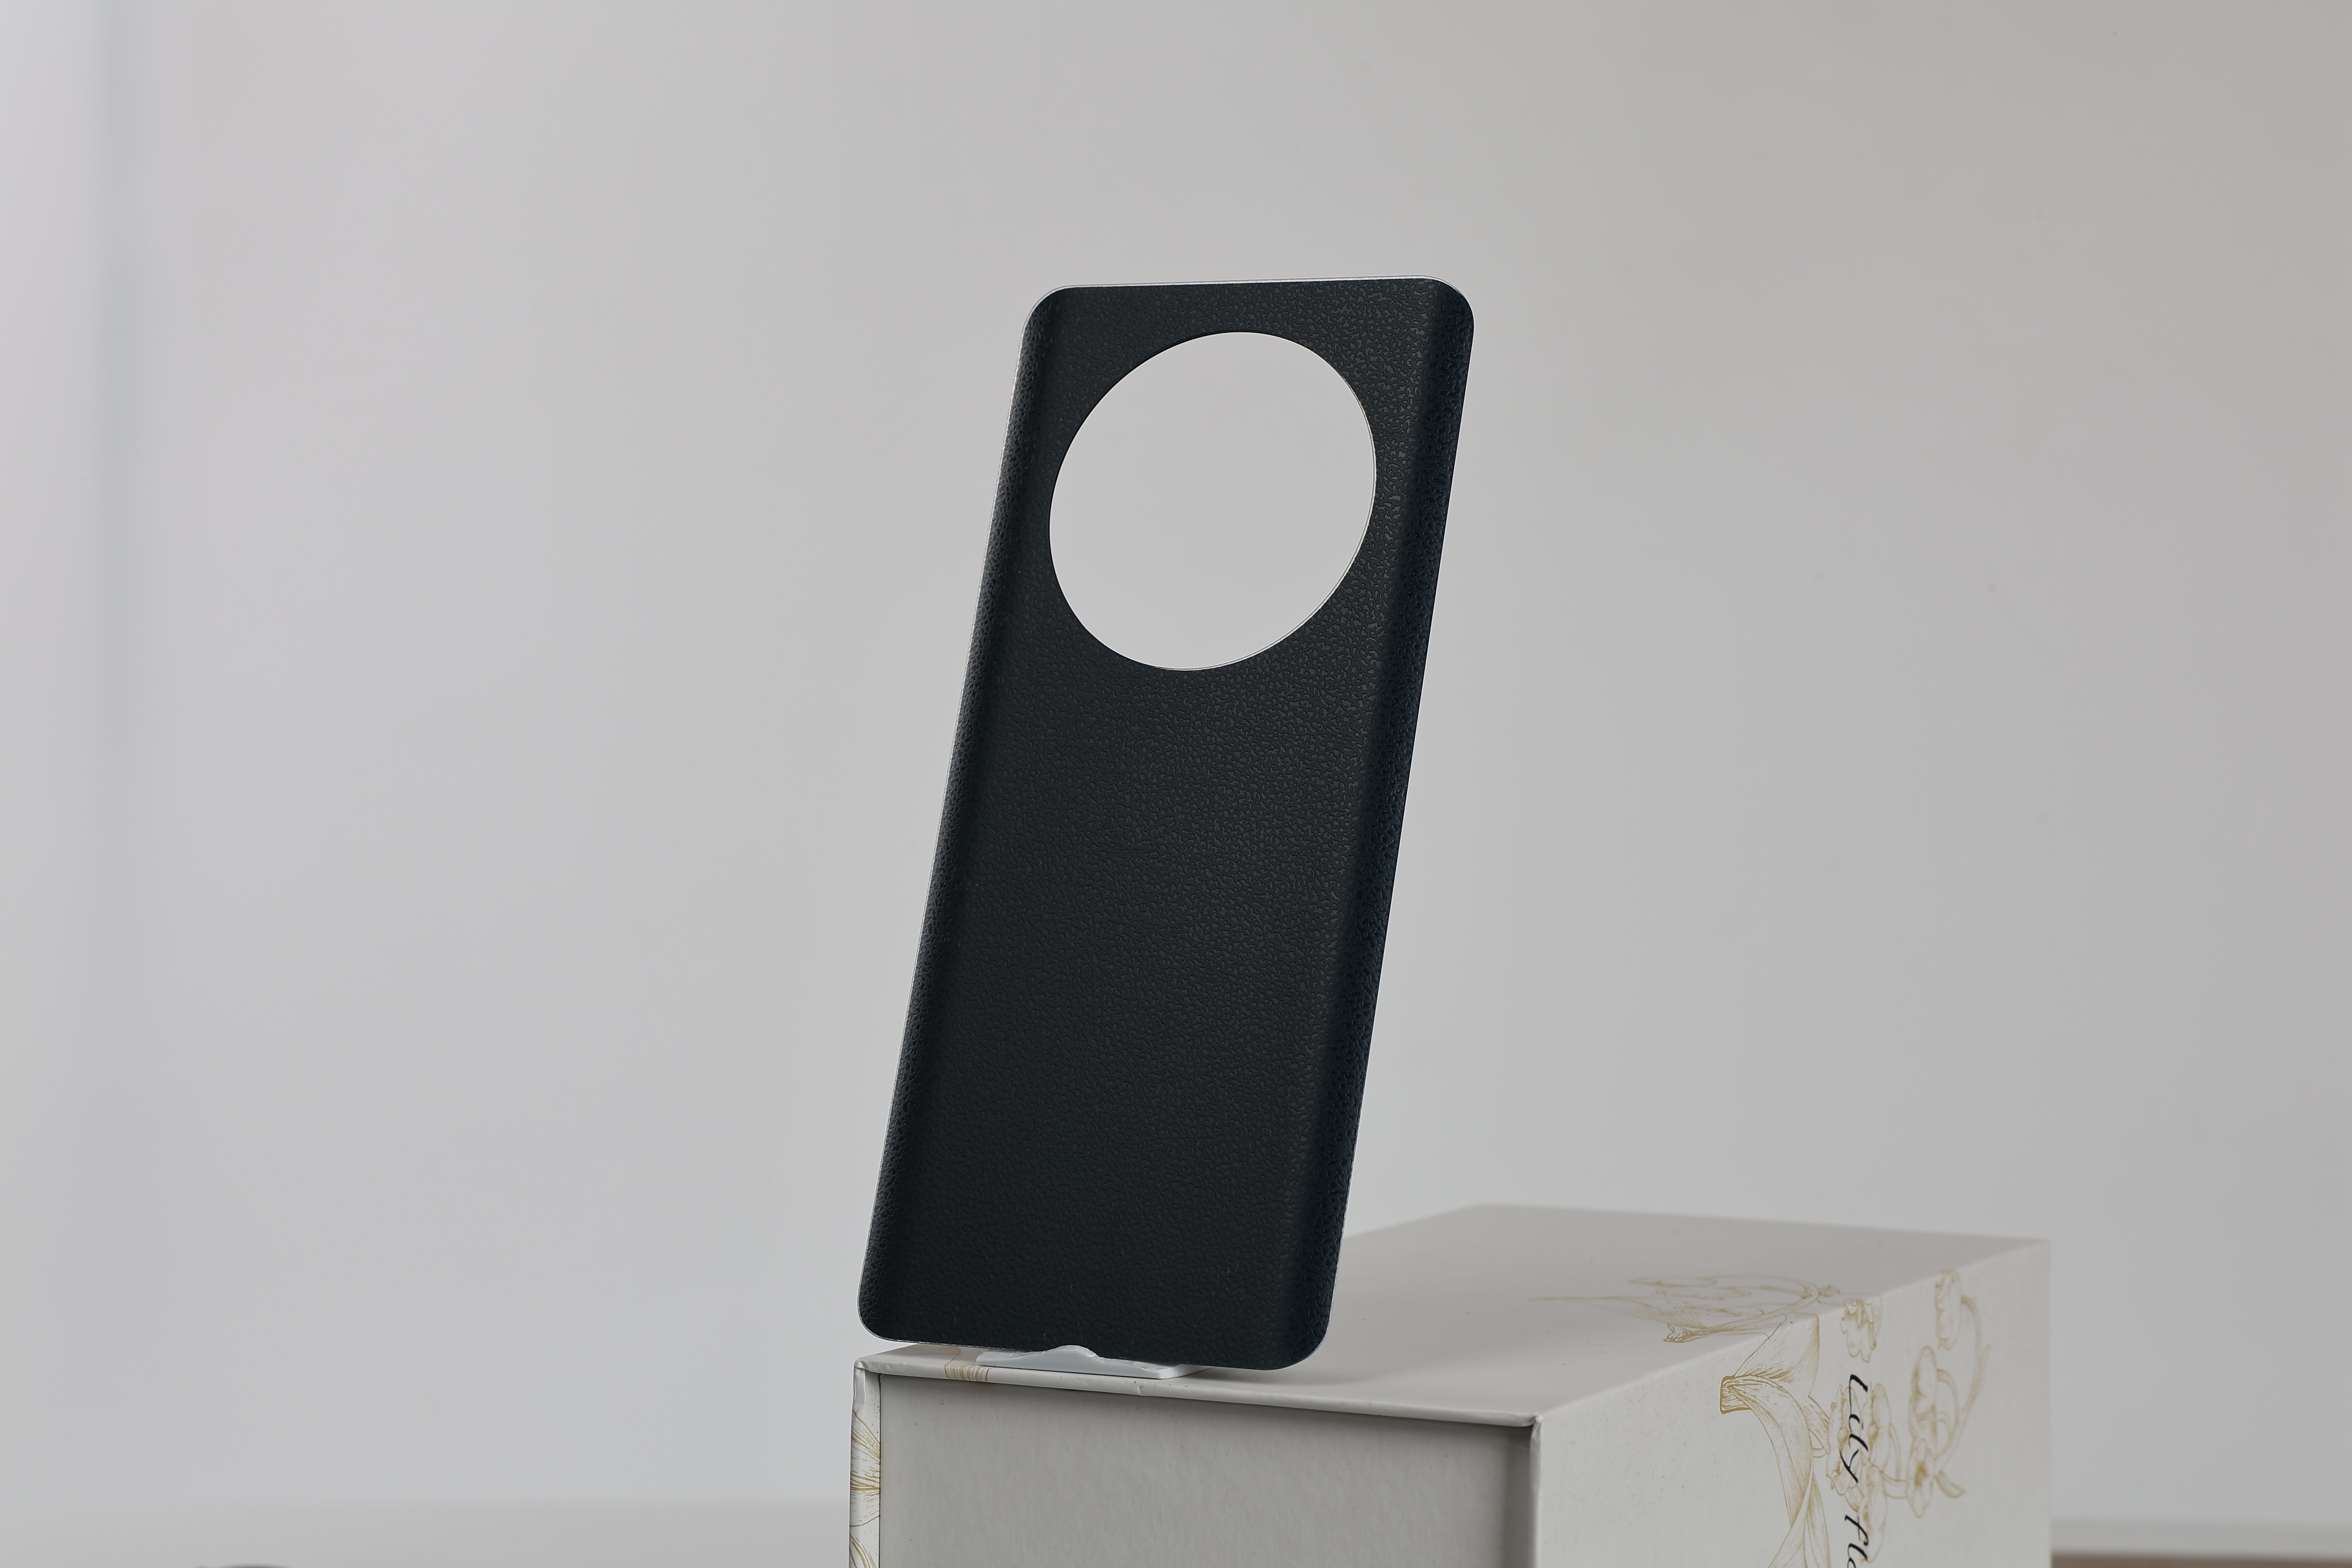
Phone Back Cover Materials: Complete Engineering Properties & Selection Guide 2026
A technical deep-dive into every material used in smartphone back covers — glass, polymer, ceramic, metal, and composites — with engineering data, manufacturing compatibility, and a structured B2B selection framework
Material selection is the single most consequential decision in phone back cover engineering. It determines not only the tactile feel and visual identity of a device, but also its 5G signal transparency, wireless charging efficiency, drop survival probability, thermal envelope, and per-unit manufacturing cost. Yet across the B2B supply chain, material decisions are often made on incomplete information — driven by marketing aesthetics rather than engineering data. This article closes that gap. We present a rigorous, measurement-based comparison of every material class currently used in mass-production smartphone back covers, along with a structured selection framework for OEMs, brand procurement teams, and product engineers making sourcing decisions in 2026.
1. Material Taxonomy: The Six Families of Phone Back Cover Substrates
The modern smartphone back cover draws from six distinct material families, each with fundamentally different atomic structures, processing pathways, and performance envelopes. Understanding these families — not as marketing labels but as engineering systems — is the first step toward rational material selection.
The industry workhorse. Corning Gorilla Glass, AGC Dragontrail, Schott Xensation — all lithium- or sodium-aluminosilicate formulations optimized through ion-exchange chemical strengthening. Dominates ~85% of the premium smartphone back cover market. Key properties: high compressive stress (CS ≥ 700 MPa), deep depth of layer (DOL ≥ 40 µm), Vickers hardness 580–650 kgf/mm².
The premium disruptor. Nano-crystalline phases embedded in a glass matrix — Apple's "Ceramic Shield" and Huawei's "Kunlun Glass" are commercial examples. Drop performance 2–4× that of aluminosilicate. Key properties: fracture toughness 1.5–2.5 MPa·m1/2, nanocrystal size 20–100 nm, transparency > 90%.
The versatility champion. Polycarbonate (PC), polymethyl methacrylate (PMMA/acrylic), and thermoplastic polyurethane (TPU) dominate mid-range and ruggedized devices. Combines low cost (USD 0.30–1.50/unit) with design freedom for complex 3D geometries via injection molding. Key properties: density 1.18–1.22 g/cm³, impact resistance superior to glass.
The ultra-premium option. Zirconia (ZrO₂) and alumina (Al₂O₃) sintered ceramics — used in flagship devices like Xiaomi MIX series and OPPO Find X series. Unmatched scratch resistance and thermal stability, but heavy and RF-opaque. Key properties: density 3.9–6.0 g/cm³, hardness > 1200 HV, zero signal transparency for mmWave.
The declining legacy. Aluminum (6000/7000 series), stainless steel (304/316L), and titanium alloys — once dominant in the unibody era, now largely replaced by glass for 5G compatibility. Still used in mid-frame structures and premium limited editions. Key properties: excellent thermal conductivity, zero RF transparency at sub-6GHz and mmWave.
The emerging frontier. Aramid (Kevlar) fiber-reinforced polymers, glass-fiber PC composites, wood-fiber biocomposites, and recycled ocean-plastic blends. Combines the processability of polymers with enhanced stiffness or sustainability credentials. Key properties: specific stiffness 2–5× vs neat PC, carbon footprint reduction 30–60%.
2. Material Properties Matrix: Quantitative Engineering Comparison
The following table presents measured engineering properties for the seven most common phone back cover materials, sourced from published manufacturer datasheets, peer-reviewed mechanical testing, and our in-house characterization lab at TenWinGlass. Values represent typical ranges for commercial-grade substrates at 0.5–0.7 mm thickness, tested at 23°C ± 2°C and 50% ± 5% RH per ASTM and IEC standards.
| Property | Alumino-silicate Glass | Micro-crystalline Glass | PC | PMMA | ZrO₂ Ceramic | Al 6061 | Aramid/PC |
|---|---|---|---|---|---|---|---|
| Density (g/cm³) | 2.40–2.48 | 2.45–2.55 | 1.19–1.22 | 1.17–1.20 | 5.95–6.05 | 2.70 | 1.25–1.35 |
| Young's Modulus (GPa) | 70–74 | 78–88 | 2.2–2.4 | 2.8–3.3 | 200–210 | 68–70 | 6–12 |
| Fracture Toughness (MPa·m1/2) | 0.70–0.75 | 1.5–2.5 | 2.0–3.5 | 0.8–1.4 | 6–10 | 28–35 | 3.5–6.0 |
| Hardness (Vickers, kgf/mm²) | 580–650 | 620–720 | 14–20 | 18–25 | 1200–1350 | 100–110 | 16–24 |
| Thermal Conductivity (W/m·K) | 0.8–1.1 | 0.9–1.2 | 0.19–0.22 | 0.17–0.19 | 2.5–3.0 | 150–170 | 0.25–0.35 |
| Dielectric Constant (εr, @1GHz) | 6.5–7.2 | 6.8–7.5 | 2.9–3.1 | 2.6–2.8 | 28–32 | Conductor (opaque) | 3.2–3.6 |
| mmWave 28GHz Loss (dB/mm) | 0.15–0.25 | 0.18–0.30 | 0.03–0.06 | 0.02–0.05 | >3.0 (blocking) | Opaque (shield) | 0.04–0.08 |
| Visible Light Transmission (%) | 91–93 | 90–92 | 88–91 | 92–93 | 0 (opaque) | 0 (opaque) | 0 (opaque) |
| Approx. Unit Cost (USD, 0.55mm) | 1.20–2.50 | 3.50–8.00 | 0.30–0.80 | 0.25–0.70 | 5.00–12.00 | 1.50–4.00 | 2.00–5.00 |
Data sourced from Corning, AGC, Schott, Covestro, Toray, Kyocera, and in-house TenWinGlass materials characterization. Unit costs are FOB Shenzhen estimates for volume orders ≥ 10,000 units in Q2 2026. Actual costs vary with geometry complexity, surface finishing, and coating requirements.
3. Deep Dive: Glass Back Covers — The Chemical Strengthening Stack
Glass back covers dominate the premium segment not by accident but by engineering necessity. Their combination of optical clarity, RF transparency, and the ability to be chemically strengthened makes them the only material class that simultaneously satisfies 5G signal requirements, wireless charging compatibility, and premium tactile aesthetics. At our production facility, glass back covers represent over 70% of total output — and the engineering behind their strength is worth understanding in detail.
3.1 The Ion-Exchange Mechanism
Chemical strengthening of aluminosilicate glass relies on the ion-exchange process, first commercialized by Corning in the 1960s and continuously refined ever since. The glass is submerged in a molten potassium nitrate (KNO₃) bath at 400–450°C for 4–8 hours. At these temperatures, the smaller sodium ions (Na⁺, ionic radius ~116 pm) in the glass surface diffuse out, while larger potassium ions (K⁺, ~152 pm) from the salt bath diffuse in — a process driven by concentration gradients and facilitated by thermal energy. The larger K⁺ ions "stuff" themselves into the Na⁺ sites, creating a compressive stress layer at the surface that acts as an armor against crack initiation and propagation.
| KNO₃ Bath Temperature | 400–450°C (dependent on glass transition temperature Tg) |
| Immersion Duration | 4–8 hours (trade-off: longer = deeper DOL, but risk of stress relaxation) |
| KNO₃ Purity Requirement | ≥ 99.5% — trace Na⁺ contamination degrades exchange efficiency |
| Typical CS Achieved | 650–900 MPa (measured by FSM-6000LE surface stress meter) |
| Typical DOL Achieved | 35–50 µm (for 0.55 mm substrate; deeper DOL for thicker glass) |
| Bath Lifetime | ~30 days — KNO₃ degrades via thermal decomposition to KNO₂; requires periodic refresh |
3.2 Glass Grade Comparison: Gorilla Glass vs Dragontrail vs Xensation
Three aluminosilicate glass suppliers dominate the smartphone ecosystem. Each has distinct compositional signatures that affect downstream processing behavior:
| Parameter | Corning Gorilla Glass 5 | Corning Gorilla Glass Victus 2 | AGC Dragontrail Pro | Schott Xensation Up |
|---|---|---|---|---|
| Base Composition | Na-Aluminosilicate | Li-Aluminosilicate | Na-Aluminosilicate | Li-Aluminosilicate |
| Typical CS (MPa) | 700–800 | 800–950 | 650–750 | 750–850 |
| Drop Survival (1m, concrete) | ~80% (up to 1.2m) | ~90% (up to 2.0m) | ~75% (up to 1.0m) | ~85% (up to 1.5m) |
| 3D Hot-Bending Temp | 680–720°C | 710–750°C | 670–710°C | 700–740°C |
| CTE (×10⁻⁶/°C, 0–300°C) | 8.5 | 7.8 | 8.8 | 7.5 |
| Substrate Cost (relative) | 1.0× (baseline) | 2.2–2.8× | 0.85–0.95× | 1.1–1.3× |
The transition from sodium-aluminosilicate (Na-AS) to lithium-aluminosilicate (Li-AS) compositions represents the single most important glass substrate evolution of the last five years. Lithium's smaller ionic radius permits a denser glass network, enabling both higher peak CS values and — critically — a two-step ion exchange process (Na⁺→Li⁺ pre-exchange followed by K⁺→Na⁺ main exchange) that produces a more gradual stress profile and superior drop performance.
4. Polymer Back Covers: The Engineering Plastics Spectrum
While glass dominates the premium tier, engineering polymers dominate volume. At price points below USD 400 retail, polymer back covers — particularly polycarbonate and its composites — account for over 60% of units shipped globally. Their manufacturing economics are fundamentally different from glass: injection molding enables single-step production of complex 3D geometries with integrated features (camera bezels, button cutouts, internal ribs) at cycle times of 15–30 seconds per part.
4.1 Polycarbonate (PC): The Dominant Choice
Unfilled polycarbonate remains the default engineering polymer for mid-range smartphone back covers. Its combination of impact resistance (notched Izod > 600 J/m), optical clarity (88–91% transmission), and moldability into complex geometries makes it the material against which all alternatives are benchmarked. Key grades used in the industry include Covestro Makrolon 2405/2407, SABIC Lexan 141R/143R, and Teijin Panlite L-1250Y. At our production steps facility, PC back covers are processed through injection molding at melt temperatures of 280–310°C with mold temperatures of 80–100°C, followed by optional hard-coating with UV-curable acrylate or polysiloxane formulations to achieve 4H–6H pencil hardness.
4.2 PMMA/Acrylic: Optical Clarity at Lower Cost
Polymethyl methacrylate (PMMA) offers the highest visible light transmission of any polymer (92–93%) and inherently better UV and weathering resistance than PC. However, its brittleness (notched Izod ~20 J/m — roughly 30× lower than PC) makes it unsuitable for drop-protection applications without secondary lamination to a PC or TPU substrate. PMMA is most commonly used as the outer decorative layer in two-component (2K) injection-molded back covers, where a clear PMMA skin is co-molded over an opaque PC core — combining PMMA's scratch resistance and clarity with PC's impact performance.
4.3 TPU: The Impact Absorption Layer
Thermoplastic polyurethane (TPU) functions primarily as a secondary impact-absorption layer rather than a standalone back cover material. Its elongation at break of 400–600% and Shore hardness range of 70A–95A make it ideal for the frame/bumper elements that absorb drop energy at the edges. In premium multi-material back cover assemblies, a 0.3–0.5 mm TPU perimeter frame is often co-molded or adhesively bonded to a rigid glass or PC center panel — a design strategy that delivers both the premium feel of a rigid back surface and the impact protection of an elastomeric edge.
5. Ceramic Back Covers: Performance at a Processing Premium
Among all phone back cover materials, sintered technical ceramics — predominantly yttria-stabilized tetragonal zirconia polycrystal (Y-TZP) — represent the highest-performance option with the most demanding processing requirements. Zirconia ceramic back covers offer scratch resistance exceeding sapphire (Mohs 8.5 vs sapphire's 9.0, but far tougher), a warm tactile feel that glass cannot replicate, and zero perceptible aging or yellowing over the device lifetime. These properties have made ceramic the material of choice for ultra-premium limited editions: Xiaomi's MIX series, OPPO's Find X Lamborghini Edition, and Huawei's Porsche Design variants.
However, the manufacturing economics of ceramic are punishing. The process flow — powder synthesis → spray granulation → dry pressing or injection molding → debinding → sintering at 1450–1550°C → diamond grinding → polishing — involves 12–18 discrete steps with cumulative yields rarely exceeding 65%. Sintering shrinkage of 20–25% linear introduces dimensional uncertainty that must be compensated in green-body design, and post-sintering diamond machining is the only viable method for achieving the ±0.03 mm tolerances required for smartphone integration. Per-unit cost runs 5–12× that of an equivalent aluminosilicate glass back cover.
Critical RF Limitation: Zirconia ceramics exhibit a dielectric constant of εr ≈ 28–32 and a loss tangent of tan δ ≈ 0.002 at 1 GHz — values that make them essentially opaque to mmWave (28/39 GHz) signals. For 5G devices requiring mmWave antenna integration, ceramic back covers necessitate either a dedicated RF-transparent window (typically a polymer or glass insert) or a complete design constraint that limits the device to sub-6GHz operation only. This RF opacity is the single greatest barrier to broader ceramic adoption.
6. The 5G Compatibility Matrix: Why Signal Transparency Drives Material Choices
The single most powerful force reshaping phone back cover material selection in the 2020s is 5G. At sub-6GHz frequencies (n77/n78/n79 bands, 3.3–5.0 GHz), the electromagnetic constraints are manageable. At mmWave frequencies (n257/n258/n260/n261 bands, 24–39 GHz), they become the dominant design constraint — and they ruthlessly eliminate entire material classes from consideration.
| Material | Sub-6GHz Compatible | mmWave Compatible | Wireless Charging Compatible | Design Requirement |
|---|---|---|---|---|
| Aluminosilicate Glass | ✅ Full | ✅ Full (0.15–0.25 dB/mm loss) | ✅ Full | No design restrictions |
| PC / PMMA | ✅ Full | ✅ Full (0.03–0.06 dB/mm) | ✅ Full | No design restrictions |
| Microcrystalline Glass | ✅ Full | ⚠️ Higher loss (0.18–0.30 dB/mm) | ✅ Full | Thickness < 0.55mm recommended for mmWave |
| ZrO₂ Ceramic | ⚠️ Limited (εr ≈ 30) | ❌ Blocked | ⚠️ Reduced efficiency | Requires RF window insert |
| Aluminum / Stainless Steel | ❌ Blocked | ❌ Blocked | ❌ Blocked (eddy currents) | Not viable for full back cover |
This compatibility matrix explains why > 85% of flagship smartphones launched since 2020 use glass back covers. Simply put: glass and engineering polymers are the only material classes that satisfy the full set of 5G + wireless charging requirements without design compromises. Metals and ceramics, despite superior mechanical properties in some dimensions, are functionally eliminated from the back cover material palette for any device targeting mmWave compatibility.
7. Surface Finishing Compatibility: Which Materials Accept Which Treatments
Material selection is inseparable from surface finishing strategy. The visual and tactile identity of a phone back cover is defined not by the bulk substrate but by the surface treatment applied to it. Each finishing technology has a specific material compatibility envelope — and choosing a material without understanding what finishes it can accept is a common source of late-stage design failures.
| Surface Finish | Alum-silicate Glass | PC | PMMA | Ceramic | Metal |
|---|---|---|---|---|---|
| AG Etching (Chemical) | ✅ Excellent | ❌ Not applicable | ❌ Not applicable | ❌ Not applicable | ❌ Not applicable |
| Frosted (Physical Blasting) | ✅ Good | ✅ Good | ✅ Good | ✅ Good | ✅ Good |
| AF/Anti-fingerprint Coating | ✅ Excellent | ⚠️ Requires primer | ⚠️ Requires primer | ✅ Good | ✅ Good |
| PVD / Sputtering Coating | ✅ Excellent | ⚠️ Low-temp only | ❌ Thermal damage risk | ✅ Excellent | ✅ Excellent |
| UV Texture Transfer | ✅ Good | ✅ Excellent | ✅ Excellent | ⚠️ Adhesion concerns | ❌ Poor adhesion |
| IMD/IML Decoration | ❌ Not applicable | ✅ Excellent | ✅ Excellent | ❌ Not applicable | ❌ Not applicable |
| Anodizing | ❌ Not applicable | ❌ Not applicable | ❌ Not applicable | ❌ Not applicable | ✅ Excellent |
| Silk-Screen / Pad Printing | ✅ Good | ✅ Excellent | ✅ Excellent | ✅ Good | ✅ Good |
8. Structured Material Selection Framework for B2B Buyers
The data above is necessary but not sufficient for making a material decision. What matters is the structured application of these engineering properties to a specific product context. The following decision framework, developed through 15 years of production experience at TenWinGlass, walks B2B buyers through the material selection process in a systematic, constraint-driven sequence.
9. Emerging Materials: What's Coming Next
The materials science pipeline for phone back covers is rich with candidates that could reshape the competitive landscape within 3–5 years:
A polycrystalline transparent ceramic originally developed for military optical windows. Combines the optical clarity of glass with the ballistic performance of ceramic — Vickers hardness ~1,800 kgf/mm² (nearly 3× that of aluminosilicate glass). Currently limited to defense applications due to cost (~USD 50–100/cm²), but sintering process improvements at Surmet Corporation are targeting smartphone-grade cost within 5 years.
A high-performance engineering thermoplastic with a glass transition temperature (Tg) of 280°C — well above the 120°C ceiling of standard PC. This enables PVD coating compatibility without thermal deformation, closing the historic gap between polymer processability and glass-like surface finishing. Currently sampling from Solvay (Torlon) and Mitsubishi Chemical.
Polymers incorporating dynamic covalent bonds (Diels-Alder adducts, disulfide metathesis) or supramolecular interactions (hydrogen-bonded networks) that can autonomously heal micro-scratches at room temperature or with mild heating (50–80°C). LG Chem and BASF have demonstrated prototypes; production-ready formulations expected by 2027–2028.
PC/PET blends derived from ocean-bound plastic waste, reinforced with short glass fiber (10–20 wt%) for stiffness. Samsung's Galaxy S23 series incorporated OBP-derived components; the material supply chain is maturing rapidly through NextLooPP and Oceanworks certification programs. Carbon footprint 40–60% lower than virgin PC.
10. FAQ: Materials Selection Questions from B2B Buyers
Q: Which material offers the best cost-to-performance ratio for a USD 300–500 retail smartphone?
For this price segment, sodium-aluminosilicate glass (Gorilla Glass 5 or AGC Dragontrail) with a simple solid-color or gradient decorative layer delivers the optimal balance. Unit cost at 10K+ volumes is USD 1.50–2.00 FOB, drop survival at 1.2m exceeds 80%, and 5G/mmWave compatibility is fully satisfied. PC back covers with UV hard-coating are a viable alternative if the brand positioning prioritizes impact resistance over premium tactile feel, at roughly 40% lower cost.
Q: Can we mix materials in a single back cover assembly?
Yes, and this is increasingly common. Three archetypes dominate: (1) glass center panel + TPU perimeter frame — combines premium glass feel with elastomeric edge protection; (2) PC structural core + PMMA decorative skin — combines impact resistance with scratch-resistant clarity in a single 2K injection-molded part; (3) glass back cover + aramid fiber inlay — the composite approach used in OnePlus and OPPO limited editions. The critical engineering consideration is CTE mismatch at material interfaces; differential thermal expansion can delaminate bonded assemblies during thermal cycling if not explicitly designed for with compliant adhesive layers (typical CTE compensation: 50–100 µm of optically clear adhesive with > 200% elongation).
Q: How does material choice affect wireless charging efficiency?
Wireless charging operates at 100–205 kHz (Qi standard) and 360 kHz (PMA). At these frequencies, eddy current losses in the back cover are minimal for all dielectric materials (glass, polymers, ceramics). The dominant variables are back cover thickness and any metallic elements. Each 0.1 mm of glass or polymer adds approximately 0.5–1.0% charging efficiency loss due to increased coil-to-coil separation. Metals of any kind in the charging path — including decorative metallic coatings — can reduce efficiency by 30–50% or trigger foreign object detection (FOD) shutdown. For optimal wireless charging design, back cover thickness should be ≤ 0.7 mm over the charging coil area, and any metallic decorative elements should be positioned outside the coil projection zone.
Q: What material-related intellectual property risks should we consider?
Corning holds an extensive patent portfolio covering aluminosilicate glass compositions, ion-exchange strengthening processes, and specific CS/DOL parameter ranges. Most commercially available aluminosilicate glass substrates are manufactured under license from Corning, AGC, or Schott — using an unlicensed substrate from a non-affiliated source carries significant IP risk. For polymer back covers, the IP landscape is considerably less concentrated: base PC and PMMA resins are generic commodities with expired composition patents. The primary IP risk in polymer systems lies in proprietary hard-coating formulations (UV-curable acrylate and siloxane chemistries) and specific IMD film decoration patterns — ensure your supplier has documented licensing or independent development provenance for these components.
Q: What is the minimum order quantity (MOQ) for custom-material back covers?
MOQ is driven primarily by substrate procurement rather than processing. Standard aluminosilicate glass (GG5/Dragontrail) and PC resin back covers have MOQs of 1,000–3,000 units — these are mainstream materials with broad distributor availability. Li-aluminosilicate glass (Victus 2/Xensation Up) typically requires 5,000–10,000 units due to allocation-based supply. Microcrystalline glass, aramid composites, and ceramic substrates carry MOQs of 10,000–20,000 units, driven by limited production capacity at the substrate level. At TenWinGlass, we maintain buffer stock of the most common glass grades to reduce lead times for small-to-medium batch orders. Contact our engineering team with your specific material specification for a tailored MOQ and lead time estimate.
11. Conclusion: Material Intelligence as Competitive Advantage
Phone back cover material selection is not a marketing decision dressed up as engineering. It is a multi-constraint optimization problem with real consequences: a wrong material choice cascades into RF certification failures, drop test rejections, supply chain delays, and per-unit cost overruns that can destroy a product's margin profile before it reaches the market.
At TenWinGlass, we operate a full in-house materials characterization lab with FSM-6000LE surface stress measurement, UV-Vis-NIR spectrophotometry, Taber abrasion testing, and thermal cycling chambers — enabling data-driven material recommendations tailored to your product specifications. Our engineering team supports the full material selection workflow: substrate recommendation → sample prototyping → qualification test plan → pilot production → mass production ramp — all from our ISO 9001-certified facility in the Pearl River Delta manufacturing cluster.
Backed by 15+ years of precision glass and polymer manufacturing · Serving OEM/ODM brands across 30+ countries